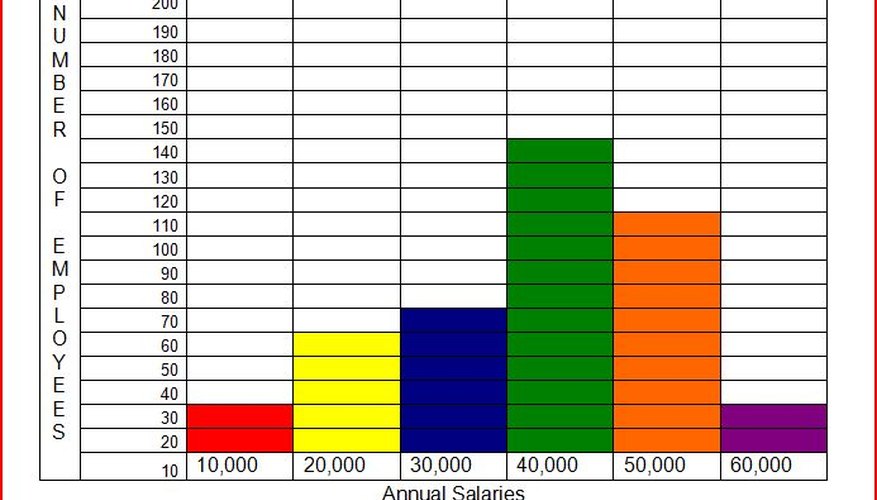
A histogram is a type of bar chart that shows numerical data. The vertical bars of this chart use proportion to display the data details clearly. Microsoft Excel is typically the go-to application for charts of this nature, but there are times when you need or want to use Microsoft Word instead. While Word does have an "Insert Chart" option, these steps will show you how to make a comprehensible histogram using a Word table instead.
- A histogram is a type of bar chart that shows numerical data.
- While Word does have an "Insert Chart" option, these steps will show you how to make a comprehensible histogram using a Word table instead.
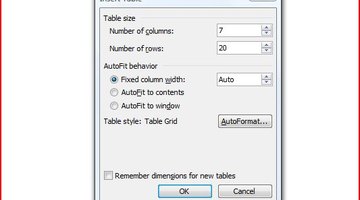
Open a blank Word document, or open the document in which you want to create a histogram. Insert a table onto the document. In Word 2007, go to the "Insert" tab, click the "Table" drop-down and select "Insert Table." In earlier versions of Word, go to the "Table" menu, point to "Insert" and click on "Table." Choose the number of columns you need in your chart, including a column to label the rows, and enough rows to present your data.
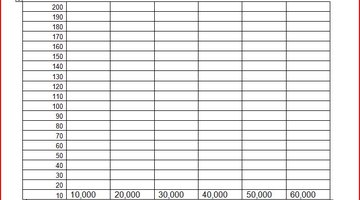
Enter the y-axis data for the histogram into the first column of the table. For example, if you are making a histogram showing how much money employees earned annually, you would put a number range for employees in each cell of the first column. Enter the x-axis data in the bottom row.
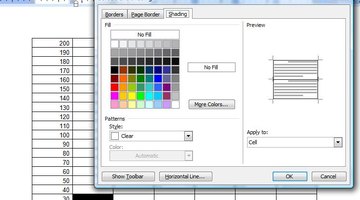
Highlight the cells in the first column to show the number of employees who earn that salary (as in the example). Right click these cells and select "Borders and Shading." Go to the "Shading" tab.
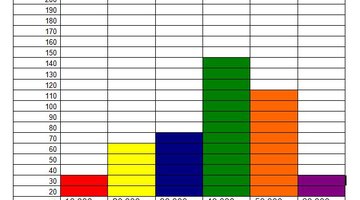
Select a fill colour for the first column. Select the correct number of cells for the second column, right click it, select "Borders and Shading," and choose a different fill colour for that column. Repeat with the remaining columns, filling each one with a different fill colour.
- Enter the y-axis data for the histogram into the first column of the table.
- Select the correct number of cells for the second column, right click it, select "Borders and Shading," and choose a different fill colour for that column.
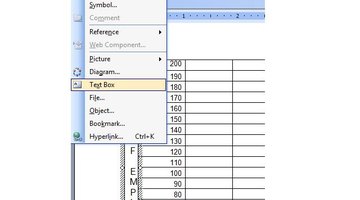
Insert a text box to the left of the table. The text box should be the same height as the column, but very narrow. To insert a text box in Word 2007, go to the "Insert" menu and click "Text Box." In previous versions, select "Text Box" from the "Insert" menu. Type the label for the y-axis column into the text box. Type the label for the x-axis data under the table and the histogram is complete.