Pie charts are visual displays that can be used to illustrate both fractions and percentages. They show how various parts compare with the whole in terms of numerical data. If you are presented with a pie chart that illustrates data in the form of percentages, you can convert these percentages into fractions with a few easy calculations. You may be required to perform this type of conversion as part of a middle, high school or college math class.
- Pie charts are visual displays that can be used to illustrate both fractions and percentages.
- If you are presented with a pie chart that illustrates data in the form of percentages, you can convert these percentages into fractions with a few easy calculations.
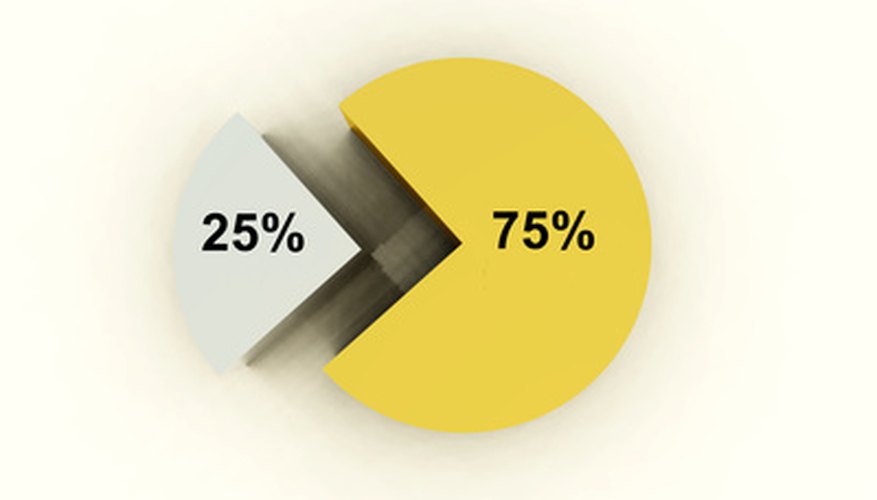
Place the percentage of a section of the pie chart over the number 100 in the form of a fraction. For example, you would convert 25 per cent to 25/100.
Reduce the fraction to its lowest terms if required. To do this, you find the largest number that will divide evenly into both the numerator (top number) and denominator (bottom number) of the fraction. For instance, the fraction 25/100 can be reduced to 1/4 because 25 divides into itself once and into 100 four times. Some fractions may be impossible to reduce (such as 33/100).
Repeat this process for each section of the pie chart.
Double-check your work by adding all of the fractions in their original form (a numerator over the number 100). The fractions should add up to 100 if you performed your calculations correctly. For instance, 25/100, 50/100, 10/100, 10/100 and 5/100 add up to 100/100, which can be reduced to "1," meaning a whole unit.